Debugging Assembly
Debugging Preparation
To debug our assembly code we need to compile and link it slightly differently. To compile main.asm use the following commands.
nasm -f elf -g -o main.o main.asm
ld -m elf_i386 -o main main.o
In the setup we’ve been using to compile and run our programs, you can change main.sh to the following
nasm -f elf -g -o main.o main.asm ld -m elf_i386 -o main main.o ./main
For reference we’ve added the
-gflag to thenasmline and removed the-sflag from theldline.
These changes generate debugging information that can be used by gdb.
Using gdb
After we have compiled and linked our assembly code we can use gdb from the terminal window.
gdb main will launch the debugger.
The prompt will change to (gdb)
gdb defaults to a different syntax to the one we are using. To change to Intel syntax enter
set disassembly-flavor intel
You will need to do this each time you start gdb.
gdb has the following commands
break xcreates a breakpoint at the labelxbreak x+ycreates a breakpointybytes after the labelxrunstarts the code running. it will stop at the first breakpointcontinuewill restart the code running if it has stopped at a breakpointstepiorsiwill run the next instruction, stepping in to any functionsnextiorniwill run the next instruction but not step in to functions
To start debugging at the start of your code use the commands
break _start
run
You can use the commands above to step through the code.
Layout
To aid in debugging we can use the layout command within gdb so that we can see the contents of the registers and the assembly code.
To set layout up, compile and link your code and run gdb as follows -
gdb main
(gdb) set disassembly-flavor intel
(gdb) break _start
(gdb) run
(gdb) layout asm
(gdb) layout regs
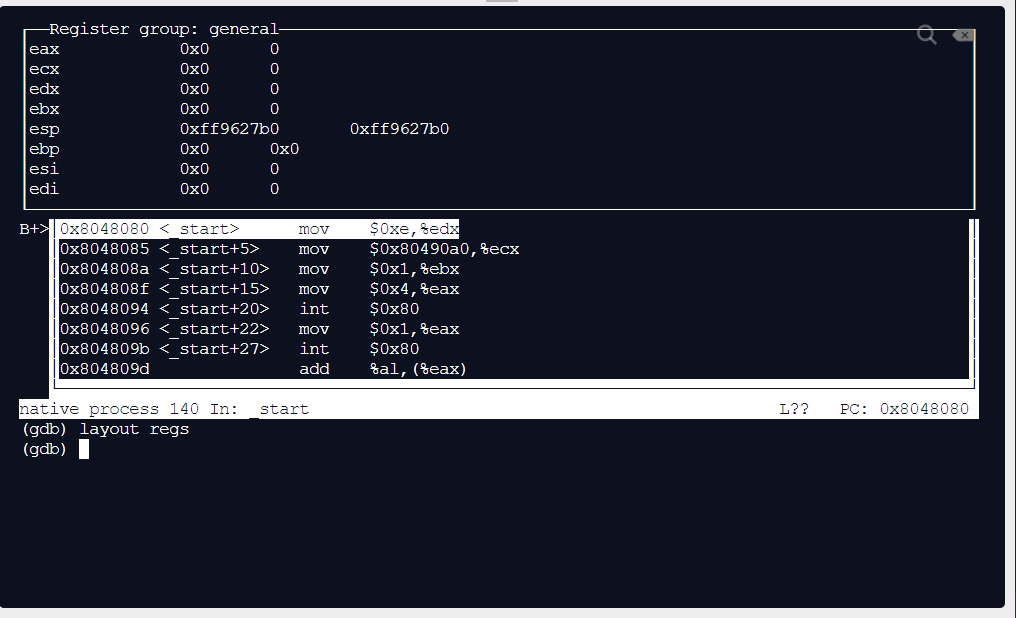
You should see something like this -

The upper section of the layout shows the registers and their contents.
The middle section of the layout shows the code with the current line highlighted.
You can enter the gdb commands in the bottom section of the layout.
As you step through the code you will see the registers updated.